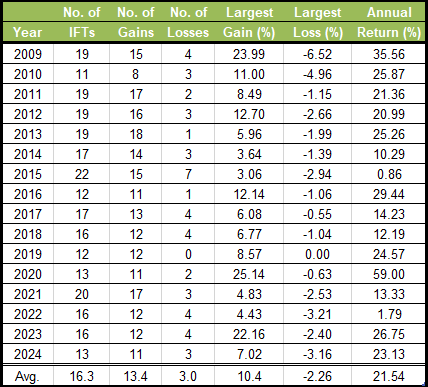
The table below presents our statistics from January 1, 2009 through December 31, 2025. Notice the system generates on average 16.2 Interfund Transfers (IFTs) per year. The system is designed to capture all large moves in the market and when the market is whipsawing, then it will produce much smaller losses. You can see these results in the largest gain and largest loss columns.
Table and Bar Chart (01/01/09 - 12/31/25):
|
The bar chart below compares our returns to the buy-and-hold strategy of investing (20% in each fund).
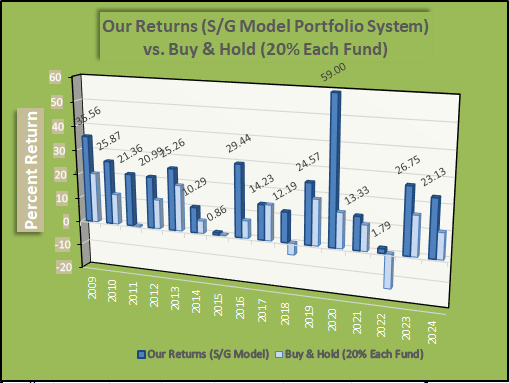
|
Our performance has been independently verified from January 1, 2009 to July 19, 2022 by Alpha Verification Services. In addition, TimerTrac has been tracking our signals since July 18, 2022. We plan on having our performance continually verified by Alpha on a yearly basis.