Year 2026 YTD Returns
Updated 06/30/2026: Our S/G Model Portfolio Trading System™ has continued its strong performance in 2026, advancing +17.39%. The system has significantly outperformed both the Buy-and-Hold strategy, which is up +9.45%, and the G Fund, which has gained +2.17%.
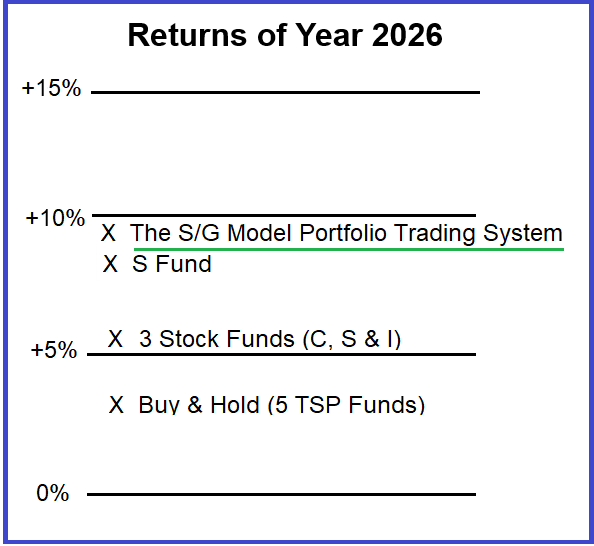
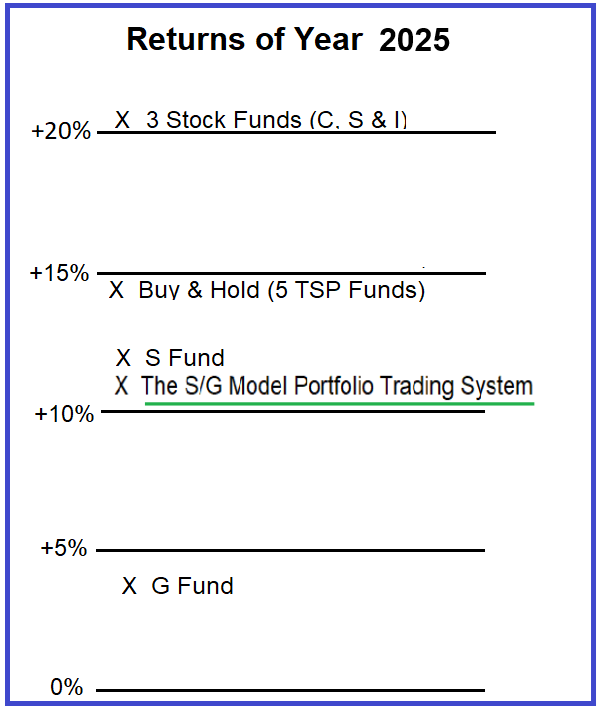
Year 2025 Returns
Our S/G Model Portfolio Trading System™ profited +10.27%. The buy-and-hold allocation (20% in each fund) returned +14.66%, while the G Fund gained +4.44%. While this marked the first time our model slightly trailed the buy-and-hold approach, results remained broadly in line with the S Fund and well ahead of the G Fund.
Year 2024 Returns
Our S/G Model Portfolio Trading System™ profited +23.13%. The buy-and-hold strategy (20% in each fund) returned +10.38%. The G Fund returned +4.40%. We outperformed the buy-and-hold strategy by +12.75%.

Year 2023 Returns
Our S/G Model Portfolio Trading System™ profited +26.75%. The buy-and-hold strategy (20% in each fund) returned +15.95%. The G Fund returned +4.22%. We outperformed the buy-and-hold strategy by +10.80%.

Year 2022 Returns
Our S/G Model Portfolio Trading System™ profited +1.79%. The buy-and-hold strategy of investing had a loss of -13.60% (20% in each fund), while the S Fund had a horrible loss -26.26%. We outperformed the buy-and-hold strategy by +15.39% and the S Fund by +28.05%.

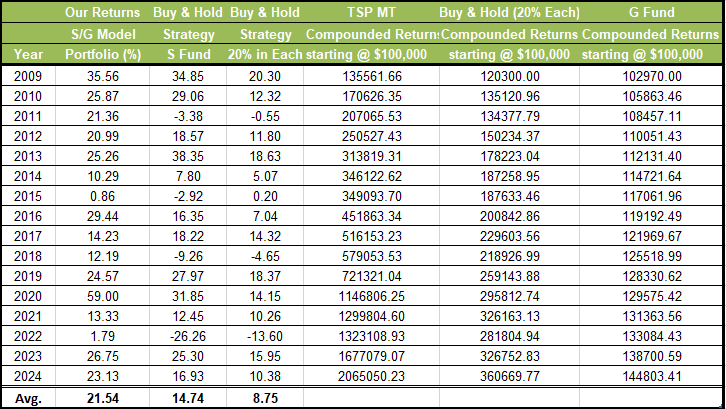
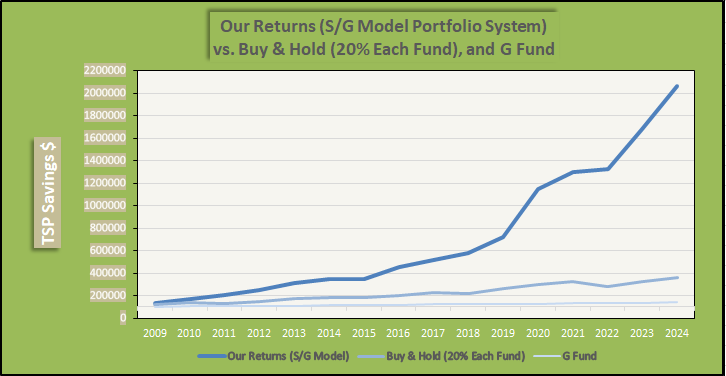
The table and line chart below presents our performance from January 1, 2009 through December 31, 2024. Our system trades only the S Fund and G Fund. We compare our results to the best performing fund – the S Fund, and to the buy-and-hold strategy of investing (20% in each fund).
Overall Returns (2009-2024)
Our trading model has outperformed the S Fund in 13 of 16 years, and the buy-and-hold strategy in 15 of 16 years. Our average return per year is +21.5%, whereas the buy-and-hold is +8.7%. The table below is updated to the end of year 2024.
Our performance has been independently verified from January 1, 2009 to July 19, 2022 by Alpha Verification Services. In addition, TimerTrac has been tracking our signals since July 18, 2022. We plan on having our performance continually verified by Alpha on a yearly basis.
Starting with a $100,000 account in year 2009, our system increased the returns to $2,065,050. During the same time, the buy-and-hold strategy of investing (20% in each fund) only increased this account to $360,669.
We show only our yearly returns and trading statistics on our site. We do not show the exact trades, since a savvy investor may try to duplicate our proprietary system. We are here to help Federal government employees and military personnel. And secondly, this service is our livelihood.
Table and Line Chart (01/01/09 - 12/31/25):
|
Our S/G Model Portfolio System has outperformed the Buy & Hold Strategy in 15 of 17 years.
|